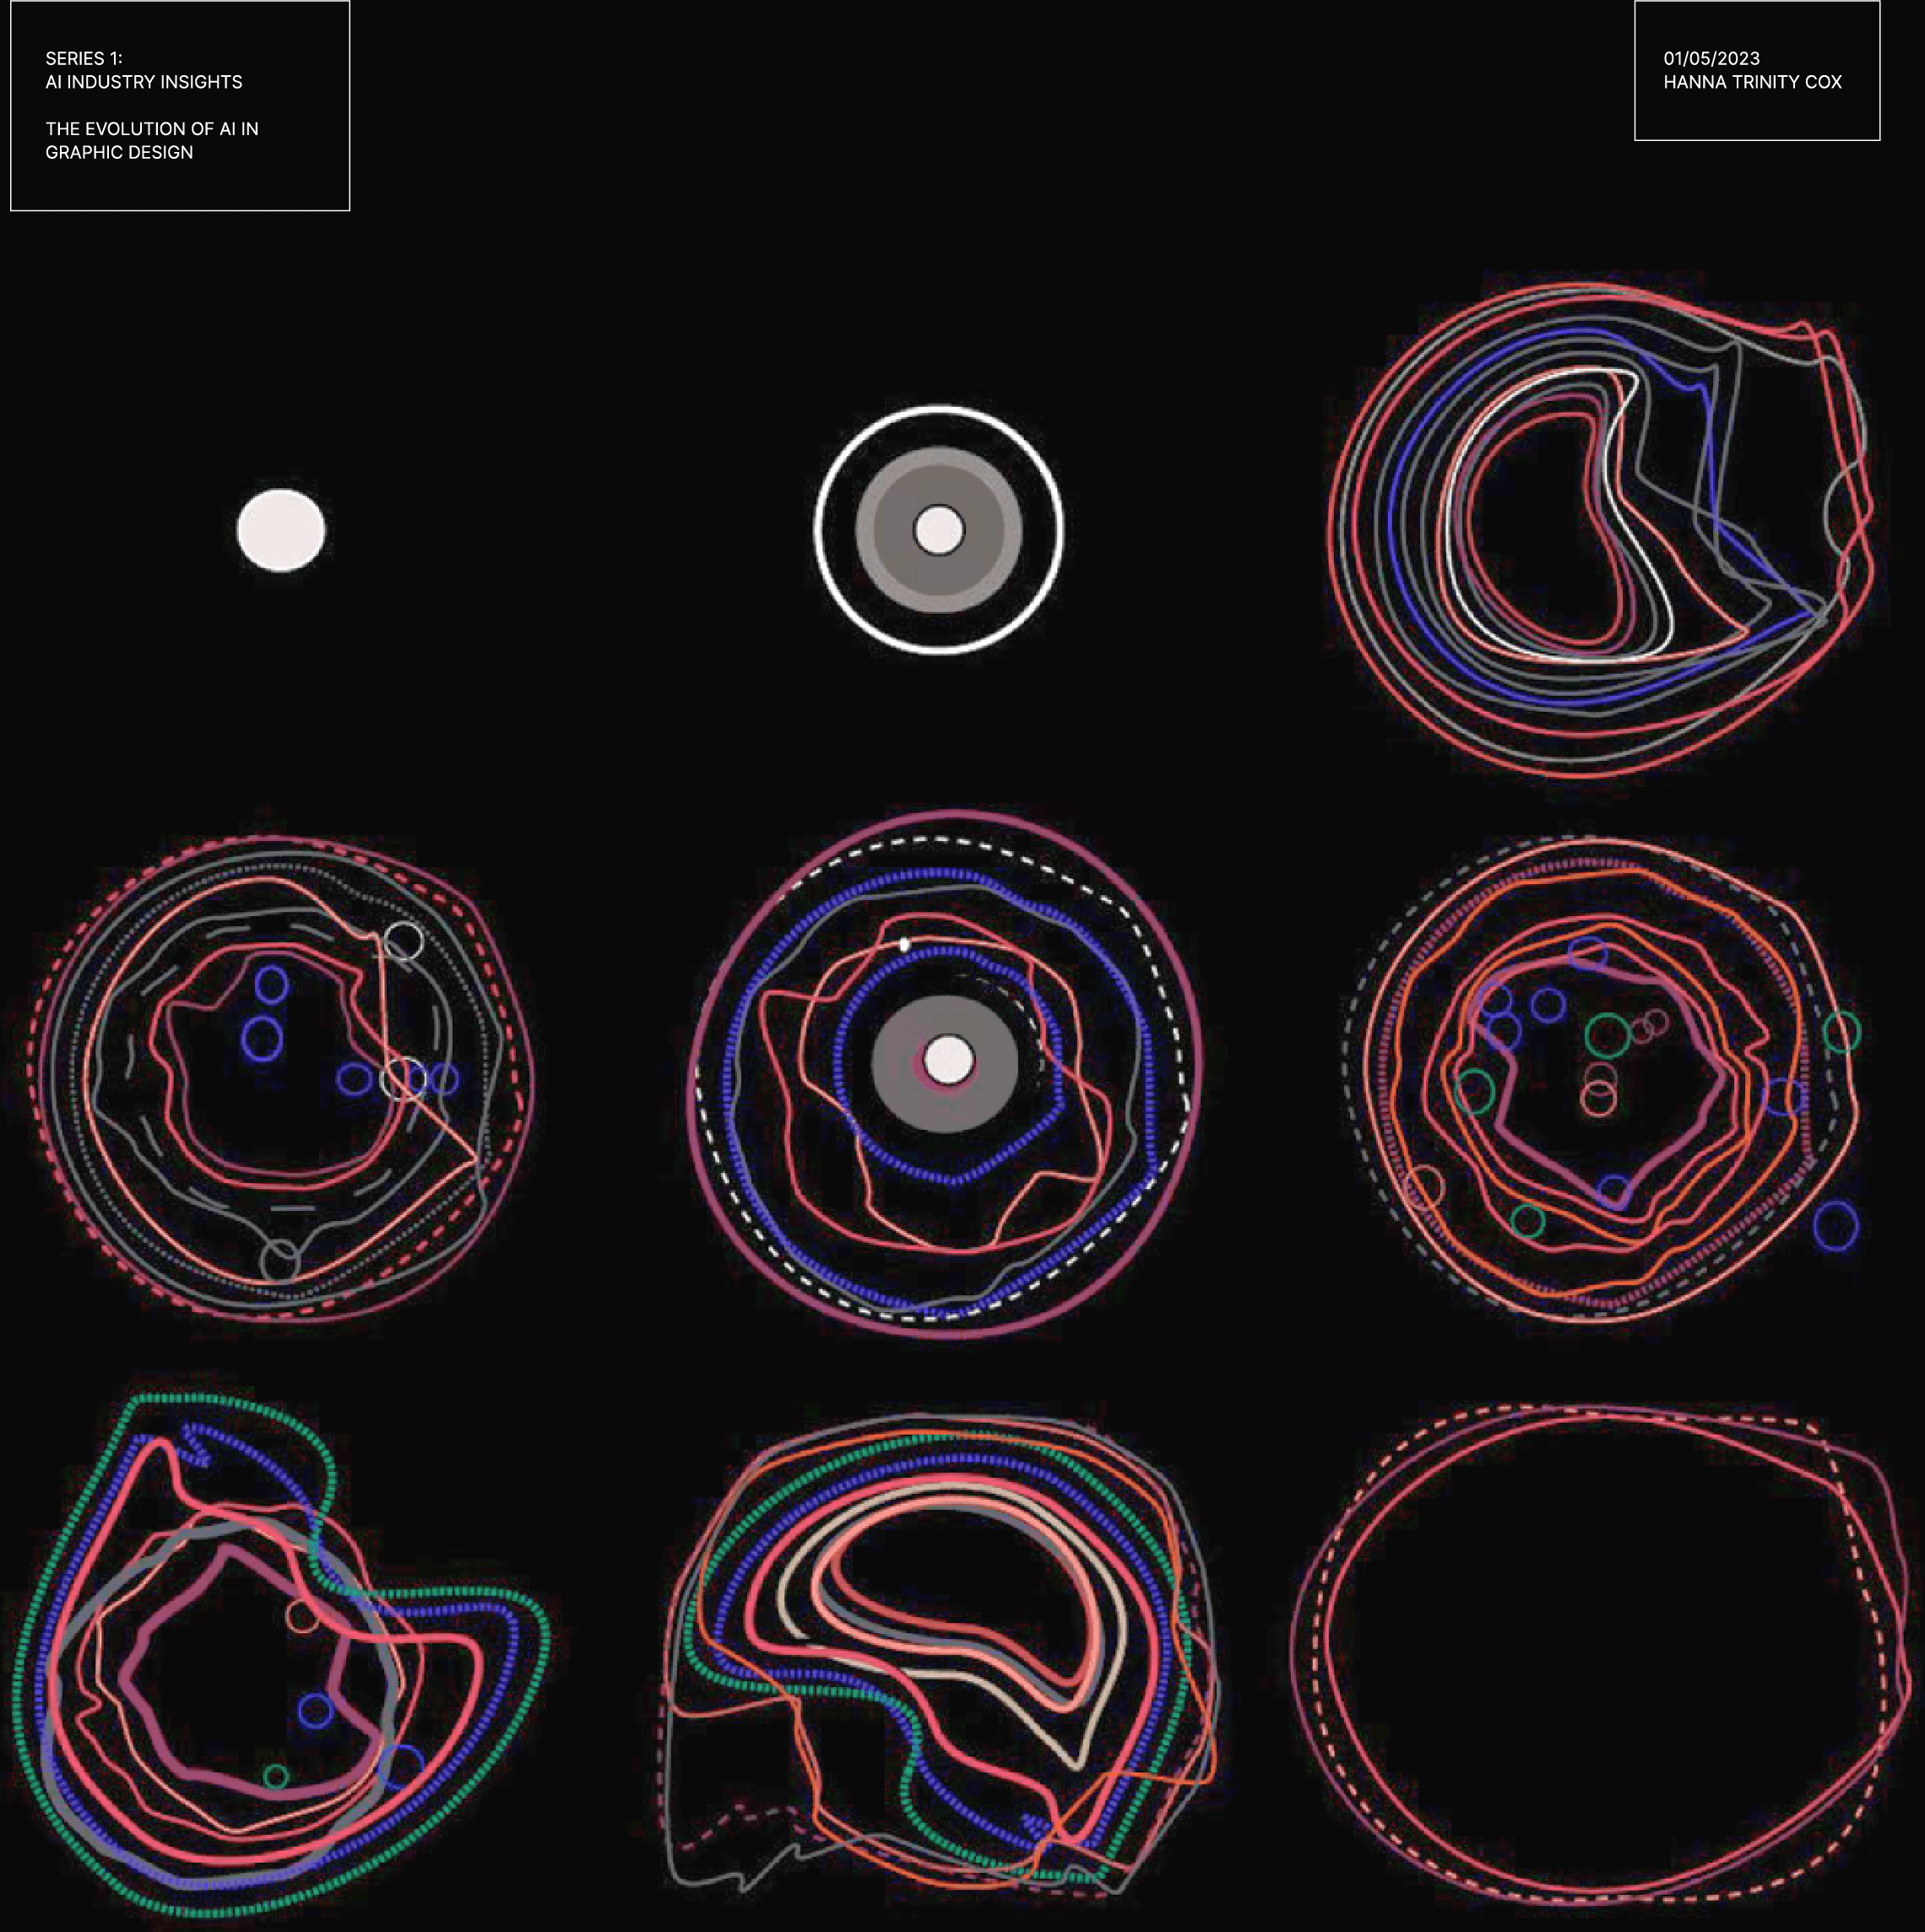
HANNA COX VISUALISES THE GROWTH OF AI IN THE CREATIVE INDUSTRIES
Hannah Cox explores ways to use graphic design, UI design, and data storytelling to create compelling and meaningful illustrated stories, whilst exploring the potential utilisation of AI as a means for enhanced creativity and expression.
Data Visualisation combines design research, information design, and graphic design. The world of data visualisation, which ranges from the uber-scientific to the wildly artistic, is growing at a faster pace than ever as visuals are relied upon more every day as a tool for communication.
“What interests me about data visualisation is that it allows us to translate this data in a purely graphic way by using the universal language of shapes, colours, and numbers.”
“We can now democratise information and overcome language barriers, going beyond simply displaying data in a text-based or quantitative format, which can often be exclusive to those who are not proficient in that language or mode of expression.”
Throughout her SIP, Hanna engaged in a continuous learning process, using visualisations as experimental grounds: “While exploring various visual techniques, I realised there is still so much more to explore in this field. I am eager to delve into coded visualisations, animated visuals, and interactive visualisations as they present new avenues for creative expression.”
This process of embarking on a self-initiated project prompted Hanna to question her personal interests and how to effectively communicate ideas.
“Through constant research and immersion in this subject matter, I have engaged in fascinating conversations and expanded my skillset, which will undoubtedly prove invaluable as I enter my final year.”
***
DPS—SIP—EXPO—2023 // DPS self-initiated projects (SIPs) have been an opportunity for UAL LCC London DPS students to express themselves via their personal projects and wider creative endeavours over the course of their DPS year.


